Study Data
The US 59 Feasibility study team collected a wide range of data for the study area including but not limited to freight movement, growth projections, traffic flow, and safety analysis.
Today there are various roadway types from Loop 20 to FM 2895 along US 59. As shown on the map, the portion of the corridor closest to Loop 20 is two or three lanes and the rest of the corridor is one lane in each direction.
Lane Type Along US 59 Corridor
Laredo is home to five ports of entry (POE) including the largest, most efficient POE on the U.S./Mexico border: the Port of Laredo.
In 2022, the Port of Laredo handled more than 5.5 million cross-border truck shipments, 290,000 rail car shipments, and 740 million pounds of air freight, representing over $299 billion in total trade with the world.
Improvements to US 59 could also provide an alternative route for trucks trying to get to Houston and therefore would alleviate overall freight traffic on I-35. Travel from Laredo to Houston is 315 miles using US 59 and 355 miles using I-35 through San Antonio.
Between 2020 and 2070, population growth within Webb County is expected to grow by nearly 67%.* Population is forecasted to grow outward from the current core area of Laredo in all directions:
- Northward up the Mines Road corridor
- Between Mines Road and IH-35
- North and west of Loop 20
- Eastward between US 59 and SH 359
- South along Cuatro Vientos Blvd and US 83
Webb County 2020-2070 Projected Population
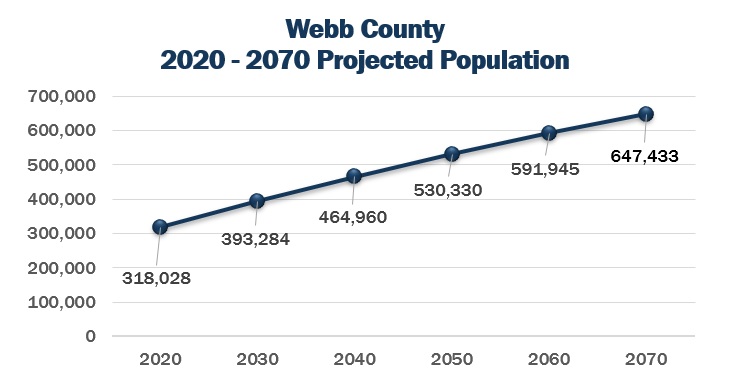
*Source: Texas Water Development Board
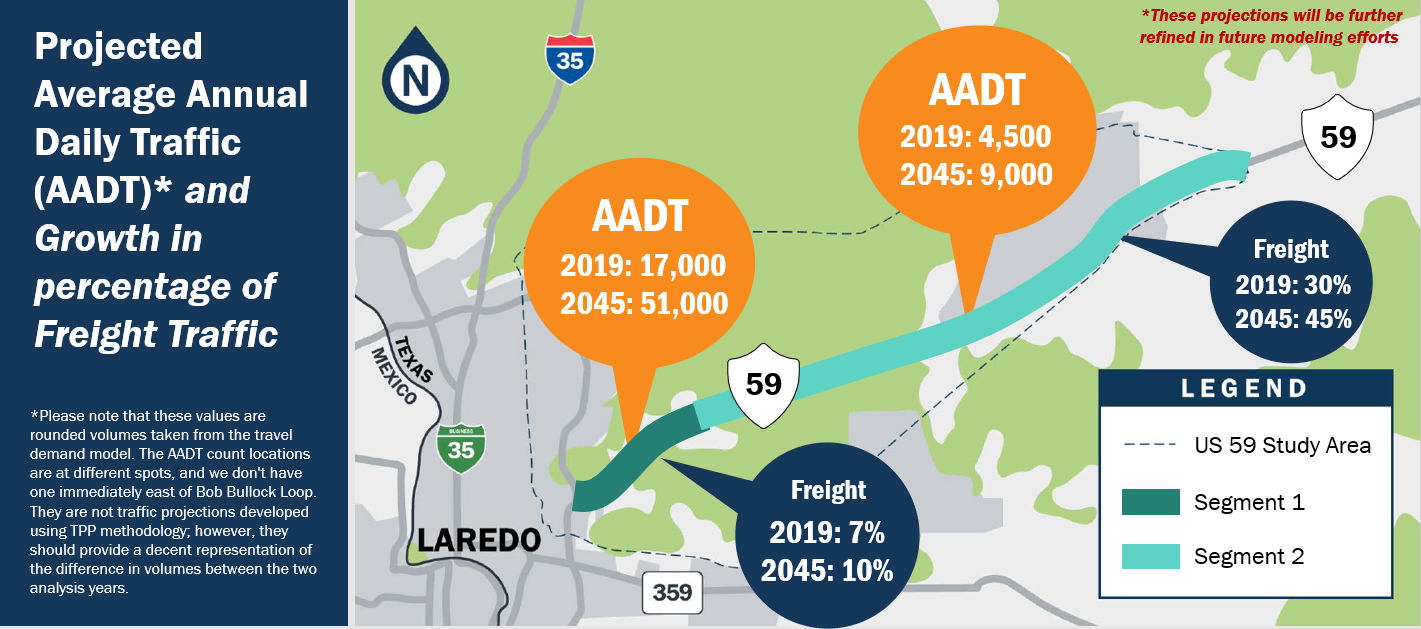
Freight traffic along the US 59 Corridor is expected to increase. Along the Bob Bullock Loop, in orange, freight traffic is expected to increase from 7% to 10% in 2045. On rural US 59, freight traffic is expected to increase from 30% to 45% in 2045.
The study also analyzed average traffic growth along the US 59 Corridor between 2015 and 2019 as well as projected traffic growth along the corridor in 2045 if no improvements are made.
Annual average daily traffic (AADT) is the total volume of vehicle traffic on a highway or road for a year divided by 365 days. The data shows a 200% projected increase in AADT in the Bob Bullock Loop section of the corridor 100% increase along rural US 59.
Projected Average Annual Daily Traffic (AADT) and Growth in Percentage of Freight Traffic 2019-2045
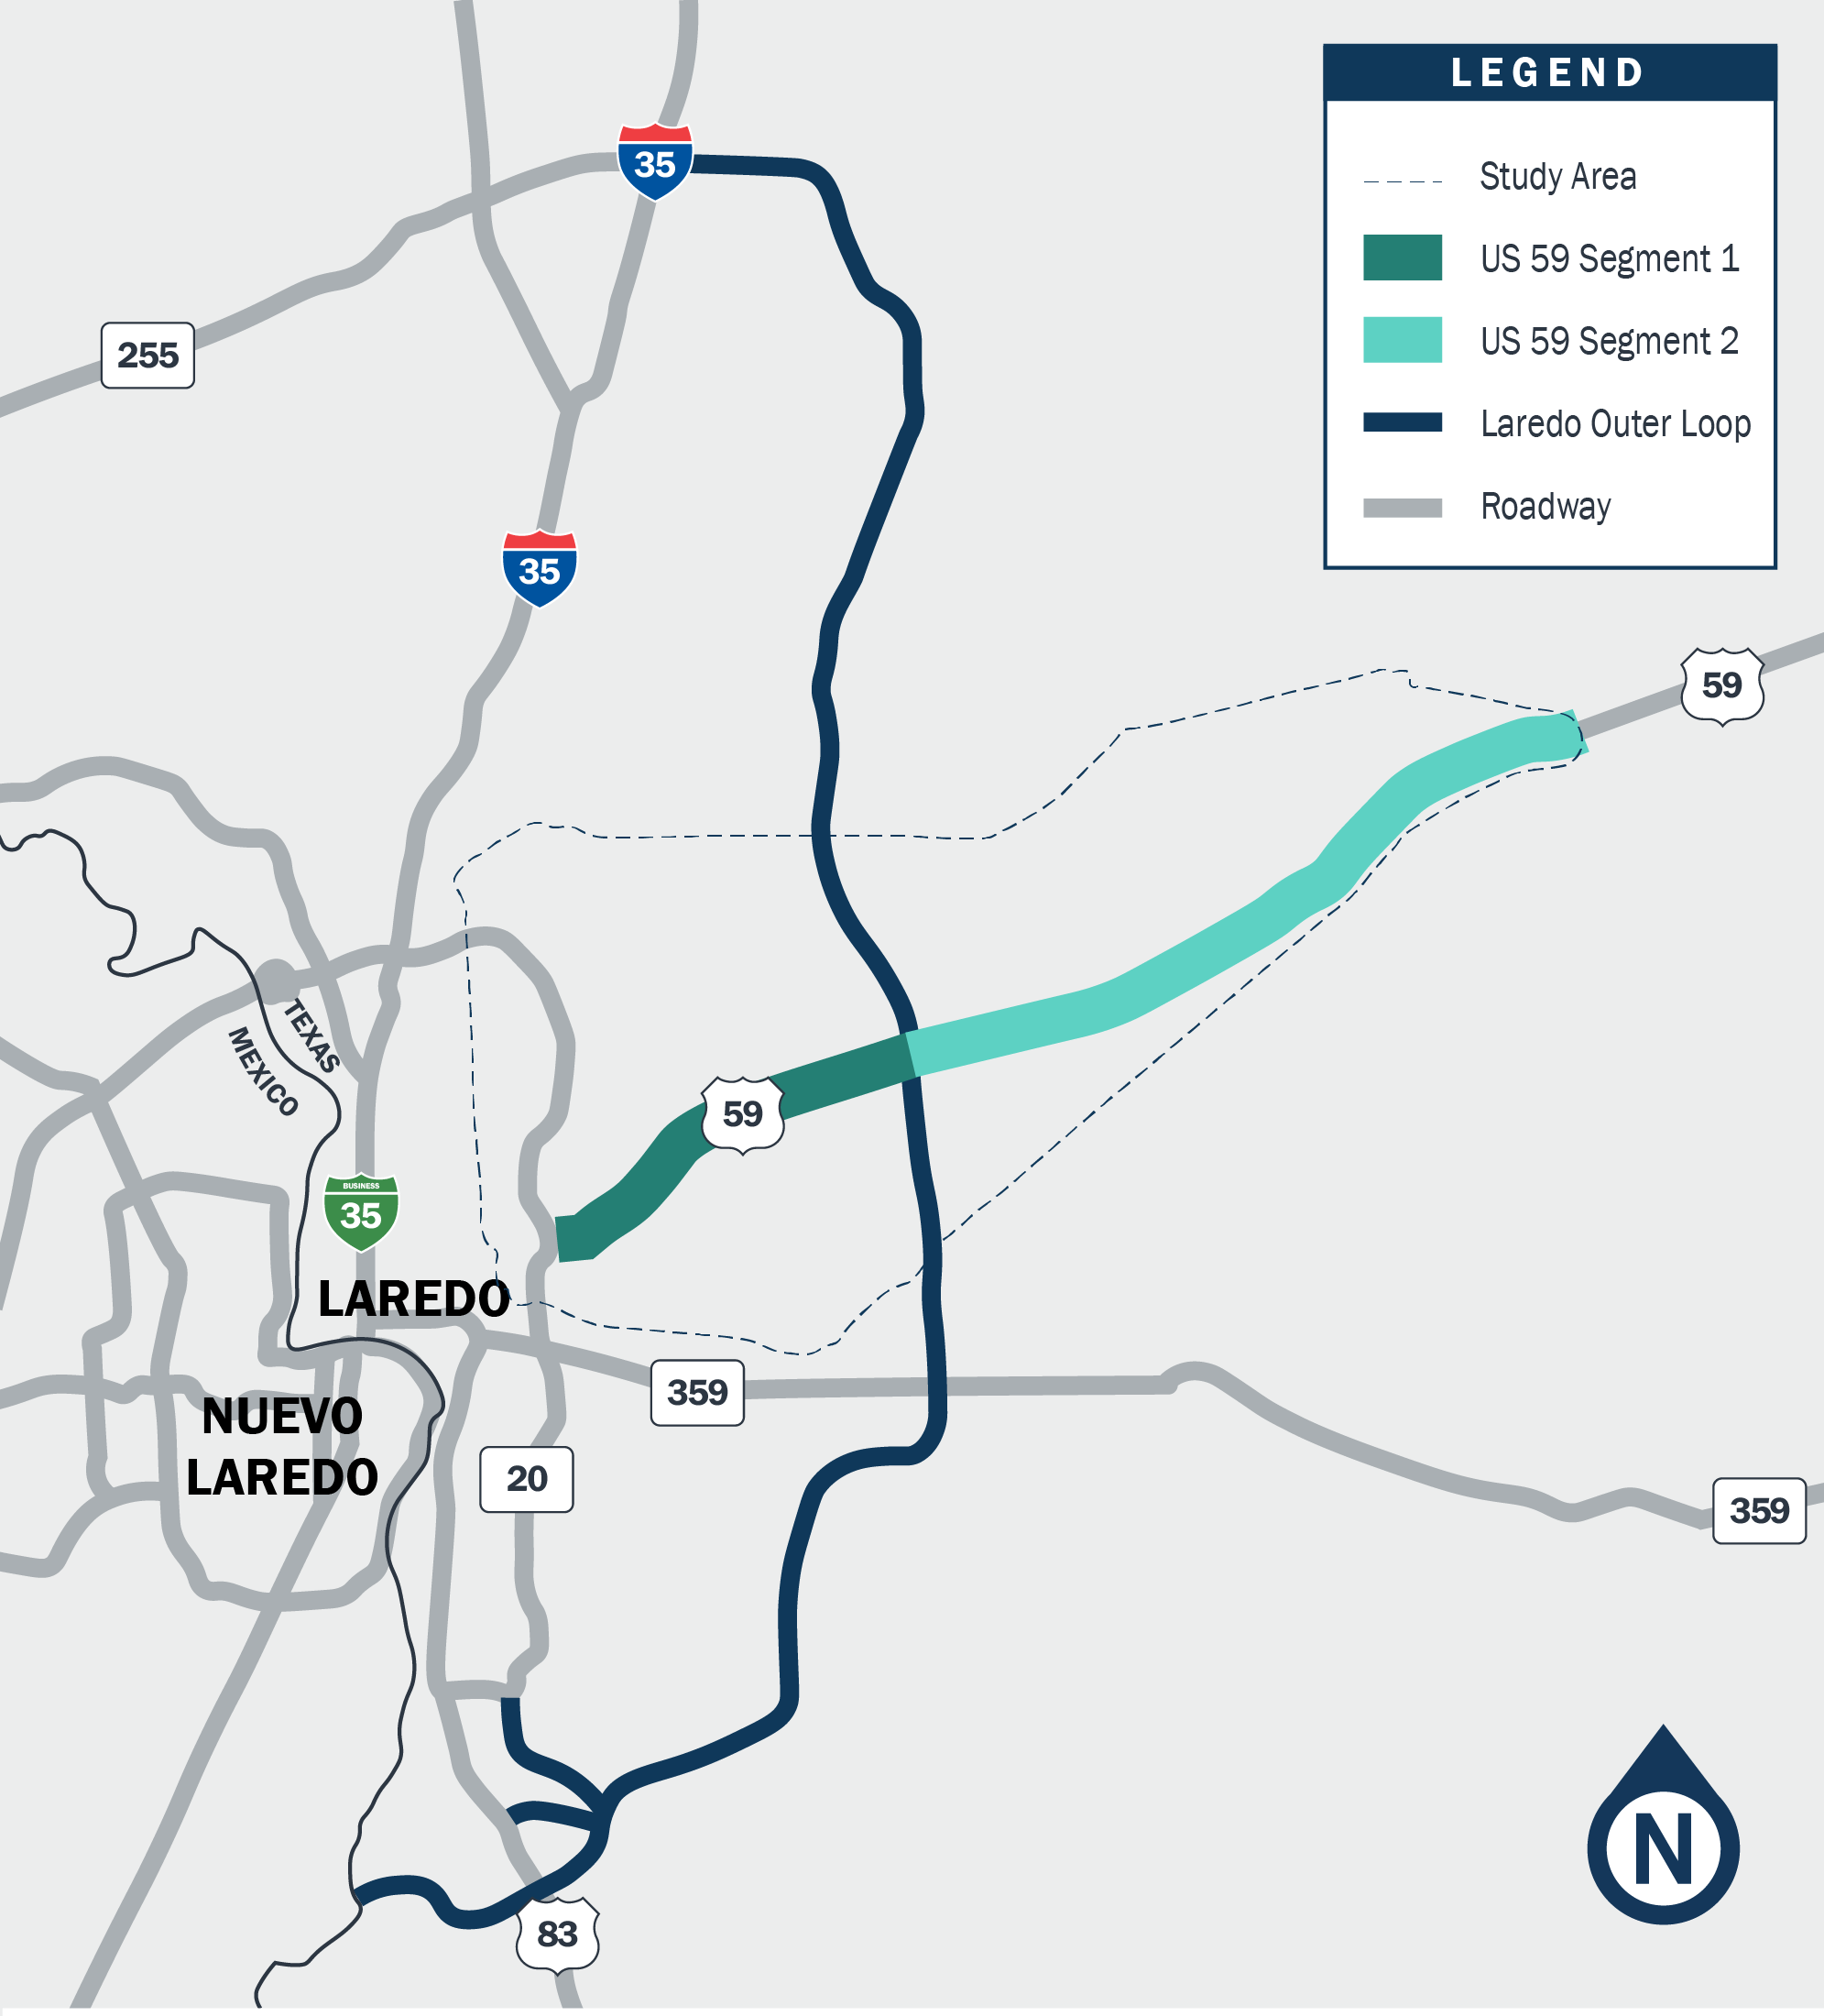
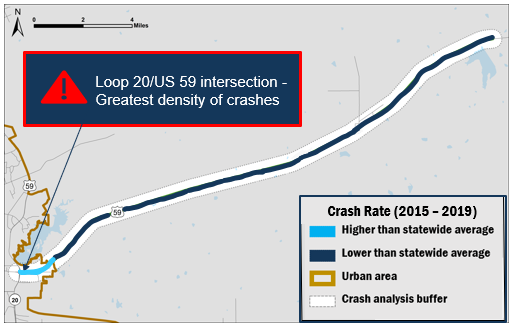
One of the key study goals is to enhance corridor safety. This map shows the study corridor divided into 2 segments – light blue is the area closest to Loop 20, the urban stretch.
This urban segment of US 59 has a crash rate 273% higher than the statewide average for urban areas, with 723 crashes per 100 million vehicle miles traveled. The greatest density of crashes were logged at the US 59/Loop 20 intersection.
The rural segment of US 59, shown in dark blue, has a crash rate lower than the statewide average for rural places, with 44 crashes per 100 million vehicle miles traveled.
Crash Rate Along US 59 Corridor (2015-2019)
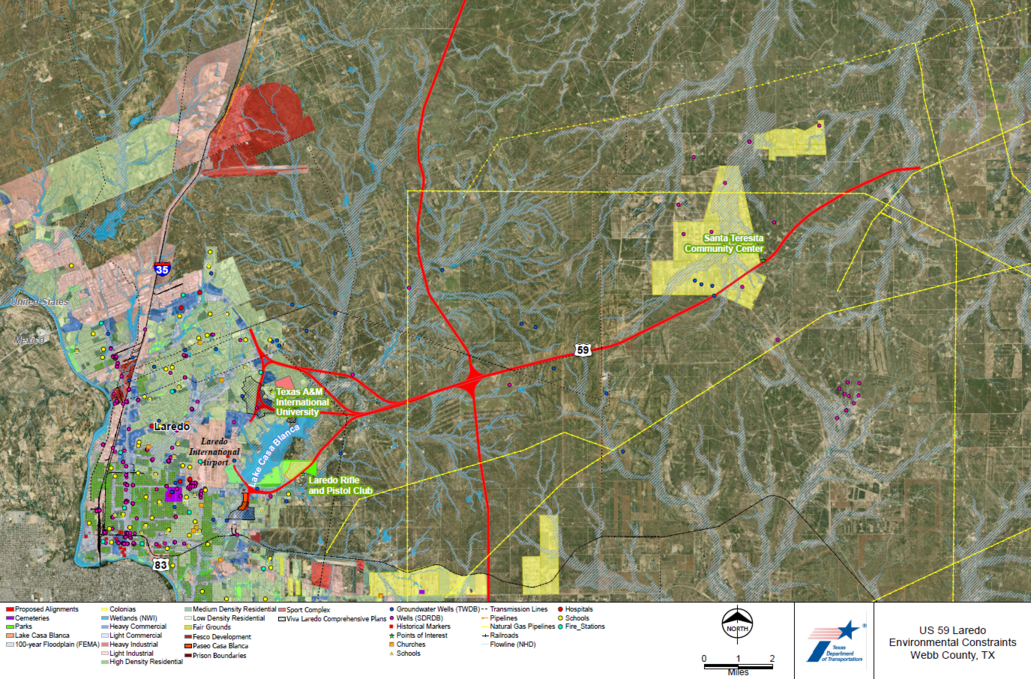
Environmental constraints are restrictions that limit the planning process, such as biological and cultural resources. The feasibility study includes identification of key environmental issues – as well as development constraints that require consideration during the planning & design phase of the project.
Environmental Constraints Map
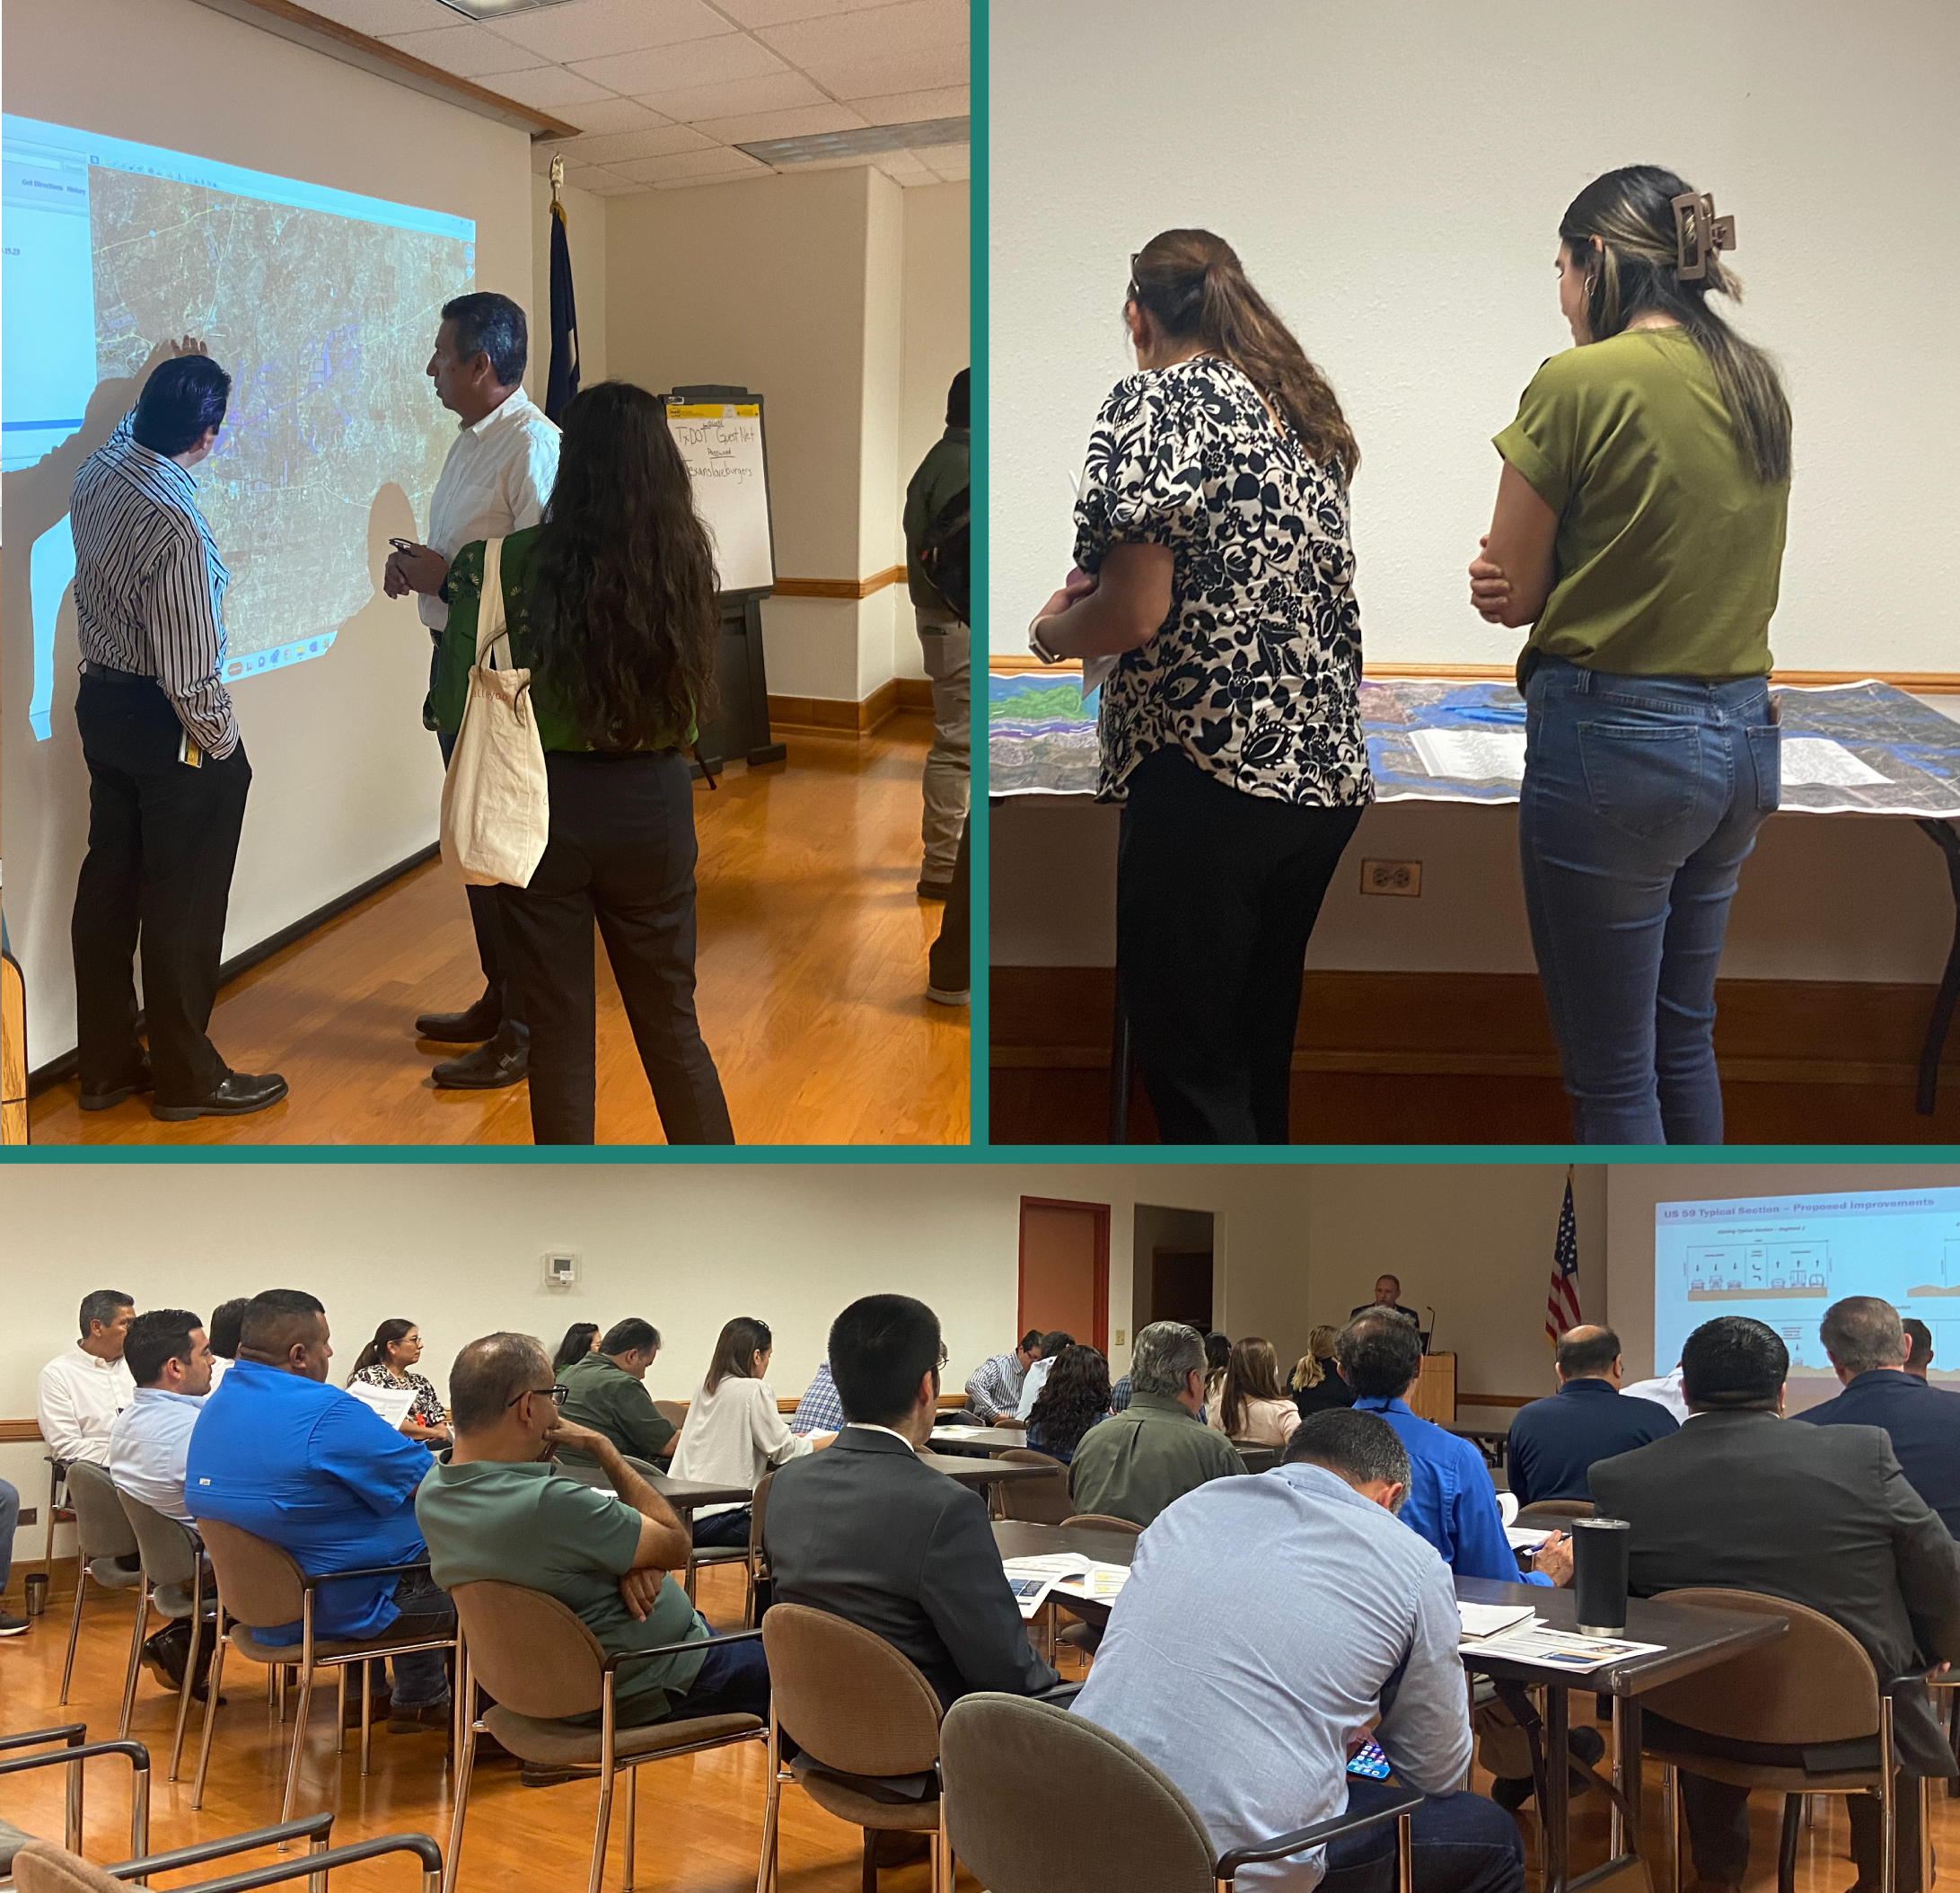
What We've Heard
The US 59 Study Team conducted two stakeholder workshops to gather input on study data and the proposed improvements. Comments from stakeholders referenced:
- Impacts to future developments
- Potential impacts and/or proximity to areas such as the colonias
- Alleviating congestion, specifically near the urban segment of the study area (along US 59/Bob Bullock Loop)
- Improving access to existing properties within the study area, such as Texas A&M International University
- Providing alternate freight routes
Please share your comments so TxDOT can consider your input, too.